News Releases
Silver Bull Files Preliminary Economic Assessment Technical Report on SEDAR for the Sierra Mojada Project, Coahuila, Mexico.
Vancouver, British Columbia - Silver Bull Resources, Inc. (TSX: SVB, NYSE MKT: SVBL) ("Silver Bull") is pleased to announce, further to its news release dated October 1, 2013, it has filed its Preliminary Economic Assessment ("PEA") Technical Report titled "Preliminary Economic Assessment NI43-101 Technical Report, Sierra Mojada Silver-Zinc Project, Coahuila, Mexico" on SEDAR at www.sedar.com. The PEA was prepared by JDS Energy and Mining Inc. ("JDS") of Vancouver, British Columbia on Silver Bull's 100% owned Sierra Mojada Project. All amounts are presented in United States dollars.
Highlights from the base case study estimates of $23.50 per silver ounce and $0.95 per zinc pound include:
- Pre-tax Net Present Value ("NPV") at a 5% discount rate of $641.1 million and an Internal Rate of Return ("IRR") of 26.9%;
- After-tax NPV at a 5% discount rate of $463.9 million and IRR of 23.1%;
- After-tax payback of 2.9 years after plant start-up;
- Pre-production capital cost ("CAPEX") of $297.2 million including a 15% contingency;
- Sustaining Capital and closure costs of $79.6 million over life of mine ("LOM") including a 15% contingency;
- An 18 year mine life, mining and processing 55.9 million tonnes of ore at 8,500 tpd, averaging 73.4 grams per tonne ("g/t") silver and 2.79% zinc, and producing 98.4 million ounces of silver doré, and 982,000 tonnes of a high quality zinc concentrate (64% zinc concentrate grade);
- An overall strip on the open pit of 5.6:1, with the first 5 years of production of the Phase 1 pit having a lower strip of 3.6:1 (see Figure 1);
- An average payable silver production of 5.5 million ounces of silver per year with a LOM cash cost of $6.58 per ounce of silver, net of by-product credits.
- Years 2 to 6 are planned to produce an average of 7 million ounces a year with a peak production of 9.3 million ounces of silver in Year 2;
- The JDS PEA does not take into account the potential mining of an additional 37 million tonnes of "lower" grade ore which is included in the resource cited below and lies immediately outside of the pit and has the potential to extend the current projected mine life.
Tim Barry, President and CEO of Silver Bull states, "We are very pleased with this Preliminary Economic Assessment. It shows the Sierra Mojada project as a robust, long life, low cost mining operation that will put it within the top quartile of global silver producing mines. We are fortunate to have a near surface high grade zone which will act as our starter pit and is expected to initially produce an average of 7 million ounces per year allowing for a fast payback on initial capital expenditures. It is also important to remember the significant upside on this project. A mineralized "lower" grade halo surrounds the core of the ore body that may be mined and could be brought into a pit at a time in which we anticipate will be a higher metal price environment. This combined with obvious extensions of mineralization to the east, west and north coupled with the numerous regional showings suggest Sierra Mojada is part of a much larger mineralizing system.
A sensitivity table showing the NPV and IRR is shown below at different silver prices.
Table 1: NPV and IRR Sensitivity Table to Ag Prices
| Ag Price Per Ounce |
Pre-Tax NPV ($M) | After-Tax NPV ($M) | Pre-Tax IRR | After-Tax IRR | Pre-Tax Payback (Years) | After-Tax Payback (Years) |
|---|---|---|---|---|---|---|
| $16 | 190.9 | 135.3 | 11.7% | 10.4% | 7.0 | 7.0 |
| $18 | 310.9 | 225.7 | 15.9% | 14.1% | 4.9 | 4.9 |
| $20 | 431.0 | 312.4 | 20.0% | 17.5% | 3.6 | 3.7 |
| $22 | 551.1 | 399.0 | 23.9% | 20.7% | 2.9 | 3.1 |
| $23.50 | 641.1 | 463.9 | 26.9% | 23.1% | 2.7 | 2.9 |
| $25 | 731.2 | 528.8 | 29.7% | 25.5% | 2.6 | 2.7 |
| $28 | 911.3 | 658.7 | 35.3% | 30.1% | 2.3 | 2.4 |
| $30 | 1,031.4 | 745.2 | 38.8% | 33.0% | 2.1 | 2.2 |
*assumed zinc price of $0.95 per pound zinc
Table 2: Capital Costs and Economic Highlights
| Summary of Results | Unit | Value |
|---|---|---|
| Silver Cash Cost (Net of By-Products) | $/oz | 6.58 |
| Avg Operating Cash Flow during Production | $M | 92.0 |
| LOM Operating Costs | $M | 1,483 |
| LOM Operating Costs / tonne milled | $/tonne milled | 26.54 |
| Capital Costs | ||
| Pre-Production Capital | $M | 260.7 |
| Pre-Production Contingency (15%) | $M | 36.5 |
| Total Pre-Production Capital Costs | $M | 297.2 |
| $/tonne milled | 5.31 | |
| Sustaining & Closure Capital | $M | 67.7 |
| Sustaining & Closure Contingency (15%) | $M | 11.9 |
| Total Sustaining & Closure Capital Costs | $M | 79.6 |
| $/tonne milled | 1.43 | |
| Total Capital Costs (incl. contingency) | $M | 376.8 |
| $/tonne milled | 6.74 |
*based on $23.50 per ounce silver and $0.95 per pound zinc prices, and silver and zinc production as outlined in Table 3
Table 3: Mine Plan Highlights
| Summary of Results | Unit | Value |
|---|---|---|
| Mine Plan | ||
| Mine Life | Years | 18.0 |
| Total Milled | M tonnes | 55.9 |
| Total Waste | M tonnes | 310.8 |
| Strip Ratio | w:tonnes milled | 5.6 |
| Average Plant Throughput | tpd | 8,500 |
| Average Head Grades | ||
| Zn | % | 2.79% |
| Ag | g/t | 73.39 |
| Production | ||
| Total Zn Concentrate Produced | dmt | 982,354 |
| Average Zn Concentrate Produced | dmt/yr | 54,559 |
| Total Zn production | M lbs | 1,178.1 |
| Average Zn produced | M lbs/yr | 65.4 |
| Total Ag Dore Produced | M oz | 98.4 |
| Average Ag Dore Produced | M oz/yr | 5.5 |
*Based on Zn price of US $0.95/lb
Resources
The initial mineral resource estimate was developed using MineSight™ software to create a partial block-model, with blocks sized 5 m x 5 m x 4 m. For the purpose of resource estimation, all assay intervals within the mineralized units were composited to two metres and grades were capped prior to estimation. All resources identified in the Lerchs Grossman (LG) optimized pit fell into the Indicated category and were reported in Silver Bull's NI43-101 resource report published on May 2, 2013.
At Silver Bull's request, JDS combined the partial model resource estimate into one standard block model compatible with Silver Bull's GEMSTM software. A small underground void was added in an area that had an overlap of solids within the silver ore body and resulted in a minor change in reportable silver grade and tonnes. JDS does not consider this change significant but it does support the recommendation for tighter geologic modeling.
The combined GEMS block model resources have been compared to the original LG optimized pit and are restated in Table 4 at the same 25g/t silver cut-off.
Table 4: Sierra Mojada Resources as of September 30, 2013, Silver and Zinc
| INDICATED | Cut-Off (Ag g/t) |
Tonnage | Silver Grade (g/t) |
Silver Ounces (Moz) |
Zinc Grade (%) |
Pounds Zinc (lbs) |
|---|---|---|---|---|---|---|
| >100 g/t | 13,500,000 | 170.2 | 74.1 | 1.57 | 466,900,000 | |
| > 80 g/t | 19,200,000 | 146.3 | 90.3 | 1.54 | 651,800,000 | |
| > 65 g/t | 25,300,000 | 128.4 | 104.4 | 1.52 | 846,000,000 | |
| > 55 g/t | 31,300,000 | 115.3 | 115.9 | 1.48 | 1,017,500,000 | |
| > 45 g/t | 39,900,000 | 101.1 | 129.6 | 1.42 | 1,243,800,000 | |
| > 35 g/t | 52,400,000 | 86.4 | 145.6 | 1.37 | 1,577,900,000 | |
| > 25 g/t | 71,100,000 | 71.5 | 163.4 | 1.34 | 2,106,800,000 | |
| > 15 g/t | 94,500,000 | 58.7 | 178.4 | 1.27 | 2,644,700,000 |
The methodology used is consistent with the Canadian Institute of Mining and Metallurgy ("CIM") definitions referred to in National Instrument 43-101. Note however that the assumptions for the LG pit were based on different parameters than those of the PEA which is now an NSR-based block model.
The NSR-based block model used for the PEA captured additional zinc resources not reflected in the above table due to different parameters applied to the block model based on the silver recovery circuit and SART process used for the PEA. This explains the difference in zinc grades shown in Table 4 above and average zinc grades shown in Table 3, Mine Plan Highlights.
In addition to silver and zinc resources, lead and copper resources were estimated although lead and copper were not considered in the PEA. Results of on-going testwork focused on the economic recovery of lead were not available at the time the PEA was completed.
Mineral resources that are not mineral reserves do not have demonstrated economic viability.
NSR/Mining Model Construction
Once sufficient work was completed on metallurgical testing for the Sulphidization-Acidification-Recycle-Thickening (SART) process, updated silver and zinc recoveries and operating cost estimates were collated for the PEA analyses to follow. The Net Smelter Return (NSR) model is based on the in situ resources for these two metals.
Results of on-going test work which focused on the economic recovery of lead were not available at the time the PEA was completed, and copper added no significant value anywhere in the envisioned process stream. Lead and copper have been excluded from the NSR model.
JDS constructed a (NSR) block model from the combined block model described above. The NSR model equates the block value to US$ to allow a Whittle™ economic optimization of the resource. The defining variables used for this work are summarized in Table 5 below.
Table 5: Parameters used to create the NSR model for the Sierra Mojada Deposit
| Parameter | Unit | Values |
|---|---|---|
| Ag price | US$/oz | 23.50 |
| Zn price | US$/lb | 1.10 |
| Exchange rate | US$:CDN$ | 1.00 |
| Ag recovery | % | 75 |
| Overall Zn recovery from Ore | % | 41 |
| Zn recovery from SART | % | 99 |
| Zn concentrate grade | % | 64 |
| Ag payable | % | 99.5 |
| Zn payable | % | 85 |
| Zn smelting cost | US$/tonne | 212.00 |
| Zn concentrate transportation cost | US$/tonne | 20.00 |
| Zn concentrate transportation insurance | US$/dmt | 0.02/100 |
| Zn concentrate transportation losses | 30% of NIV | 0.5/100 |
| Zn Price Participation* | US$/dmt | 5.66 |
| Ag refining | US$/payable oz | 0.225 |
| Ag doré transportation | US$/ payable oz | 0.15 |
| Ag transportation insurance | US$/ payable oz | 0.12 |
| Zn dilution factor | 1.00 | |
| Ag dilution factor | 1.00 | |
| Short tons to pounds | 2000 | |
| Lbs to metric tonnes | 2204.6 |
Mining
The mine plan developed for the PEA mines the Sierra Mojada deposit in a series of five phases which have been scheduled targeting ore of the highest value early in mine life. This is done to accelerate capital payback and maximize cash flow.
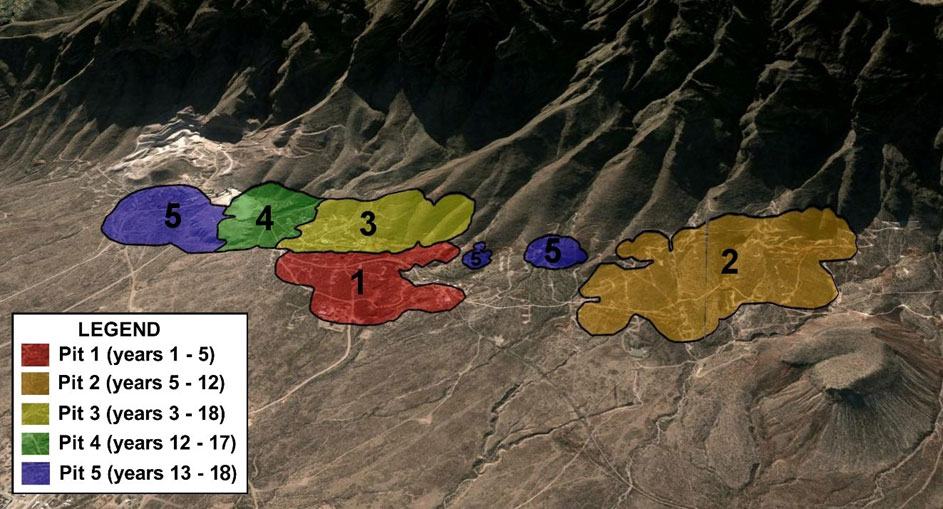
Figure 1. Image showing the staged zones of the open pit and the years these zones will come into effect.
Standard open pit mining methods are utilized in the mine plan involving typical drilling, blasting, and material movement using shovels and trucks. The fleet required to mine all potential ore-grade material and associated waste has been identified with the primary fleet and ancillary/support equipment prices obtained from recent quotes. The primary fleet quoted consists of Caterpillar 777G trucks, 992K wheel loaders, D10T and D9T track dozers, MD6290 and MD6540 rotary drills, and Komatsu PC2000 front shovels.
The Base Case economics utilizes a leased mining fleet over the life of mine with realistic market terms expected from equipment dealers in Mexico at a 7% interest rate. Mining costs per tonne are based solely on fleet operating costs. Leasing costs are applied separately and included in overall operational costs.
In Year 2 of mine operations, a contractor fleet would be used to supplement pre-stripping of Phase 3. The additional waste stripping required in Year 2 is short-lived and does not justify the purchase of additional equipment. This schedule also creates the ability to backfill Phase 1 beginning in Year 5 and Phase 2 in Year 13 without affecting ore delivery to the plant - effectively maximizing backfill potential and minimizing surface area required for waste rock storage and also minimizing haulage costs. Mining Phases 3, 4, and 5 during Years 15 through 17 would also require assistance by contractor mining. Contractor costs have been assumed to be equal to owner mining costs plus 20% and have been incorporated into the economic model based on projected contractor unit requirements.
Processing
A planned Sierra Mojada process plant is designed to process polymetallic mineralization at a rate of 8,500 tonnes per day. The process facility design consists of a primary crushing plant, grinding circuit, agitation leaching for silver recovery and a Bio-SART plant that not only produces a high-grade zinc concentrate but also recovers an estimated 95% of cyanide used in leaching for re-use. The process plant is planned to operate two shifts per day and 365 days per year with an overall availability of 92%. The process plant would produce silver doré and zinc concentrate as separate saleable products.
Infrastructure
The Sierra Mojada project is accessible by paved highway and there is a rail line in use nearby that could be extended to the conceptual plant site location for delivery of bulk supplies and transport of zinc concentrates. Power can be provided either through the national grid which would require extending main transmission lines to the site, or generators located at site or off site. Diesel and natural gas generation were considered, and the choice of natural gas generators located proximal to an existing natural gas supply line in combination with lower-voltage transmission lines to site was deemed a reliable, lowest cost option among the alternatives considered. Make-up water supply is planned to be sourced from regional groundwater sources.
Capital Costs
The initial capital requirement for the Project is estimated to be US$297.2 M, as detailed in Table 6.
Table 6: Sierra Mojada Pre-production Capital Cost Estimate as of September 30, 2013
| Pre-Production Capital Costs | Estimate (M$) |
|---|---|
| Pre-Stripping | 10.9 |
| Mining Equipment | 10.5 |
| Site Development | 4.8 |
| Crushing & Coarse Ore Stockpile | 14.2 |
| Processing Plant | 69.2 |
| Tailings | 9.4 |
| On-Site Infrastructure | 24.3 |
| Off Site Infrastructure | 39.2 |
| Project Indirects | 38.4 |
| Engineering & EPCM | 29.9 |
| Owner's Costs | 5.6 |
| Pre-Production Lease Payments | 4.3 |
| Total Pre-Contingency Initial Capital Costs | 260.7 |
| Contingency | 36.5 |
| Total Pre-Production Capital Costs | 297.2 |
The Project has a total sustaining capital requirement of $60.9M. Closure costs amount to $6.8M. Contingency for sustaining and closure capital amounts to $11.9M.
Operating Costs
Total operating costs per tonne ore milled for the Project are outlined in Table 7.
Table 7: Sierra Mojada Estimated Unit Operating Costs
| Operating Cost | $/tonne milled |
|---|---|
| Mining ($1.68 per tonne mined) | 11.03 |
| Processing | 11.55 |
| G&A | 1.39 |
| Leasing | 2.57 |
| Total Operating Cost | 26.54 |
Financial Analysis and Sensitivities
Using a silver price of $23.50/oz and a zinc price of $0.95/lb, the study yields a pre-tax NPV5% of $641.1 million and IRR of 26.9% with a payback period of 2.7 years. After-tax NPV5% amounts to $463.9 million and an IRR of 23.1% with a payback of 2.9 years.
It must be noted that all economic results reported in a PEA are preliminary in nature and as such may vary considerably from actual results. The project does not currently have any mineral reserves as the declaration of reserves requires at least a pre-feasibility study to be completed.
Table 8: Project NPV Sensitivity to Discount Rate
| Discount Rate | Pre-Tax NPV (M$) | After-Tax NPV (M$) |
|---|---|---|
| 0% | 1,280.5 | 945.4 |
| 5% | 641.1 | 463.9 |
| 7% | 491.1 | 350.3 |
| 8% | 430.2 | 304.0 |
| 10% | 329.9 | 227.7 |
The figures in the above news release do not take into account the proposed Mexico tax reforms which are expected to be finalized before December 31, 2013
Qualified Persons
The PEA was conducted under the overall review of Gordon Doerksen, P. Eng. of JDS Energy and Mining Inc. of Vancouver, British Columbia with the following Qualified Persons contributing to their respective sections:
| Gordon Doerksen | P. Eng., Project Director, JDS Energy and Mining Inc. | |
| Greg Blaylock | P. Eng., Associate, JDS Energy & Mining Inc. | |
| Richard Boehnke | P.Eng.,Engineering Manager, JDS Energy & Mining Inc. | |
| Allan Reeves | P.Geo., Senior Geologist, JDS Energy & Mining Inc. | |
| Bill Pennstrom | QP Metallurgy, President Pennstrom Consulting Inc. - Process Flow Sheet Development and Operating Costs |
|
| Ken Embree | P.Eng., Knight Piesold Ltd., Tailings Facility |
The foregoing Qualified Persons have verified that the data from the PEA is fairly and accurately disclosed in this news release. Scientific and technical information not directly summarized from the contents of the PEA was reviewed and approved by Greg Blaylock, a Qualified Person as defined by NI 43-101.
On behalf of the Board of Directors
"Tim Barry"
Tim Barry, MAusIMM
Chief Executive Officer, President and Director
INVESTOR RELATIONS:
Matt Hallaran
+1 604 336 8096
info@silverbullresources.com
Cautionary Note to U.S. Investors concerning estimates of Indicated and Inferred Resources: This press release uses the terms "indicated resources" and "inferred resources" which are defined in, and required to be disclosed by, NI 43-101. We advise U.S. investors that these terms are not recognized by the United States Securities and Exchange Commission (the "SEC"). The estimation of indicated resources involves greater uncertainty as to their existence and economic feasibility than the estimation of proven and probable reserves. U.S. investors are cautioned not to assume that indicated mineral resources will be converted into reserves. The estimation of inferred resources involves far greater uncertainty as to their existence and economic viability than the estimation of other categories of resources. U.S. investors are cautioned not to assume that estimates of inferred mineral resources exist, are economically minable, or will be upgraded into measured or indicated mineral resources. Under Canadian securities laws, estimates of inferred mineral resources may not form the basis of feasibility or other economic studies.
Disclosure of "contained ounces" in a resource is permitted disclosure under Canadian regulations, however the SEC normally only permits issuers to report mineralization that does not constitute "reserves" by SEC standards as in place tonnage and grade without reference to unit measures. Accordingly, the information contained in this press release may not be comparable to similar information made public by U.S. companies that are not subject NI 43-101.
Cautionary note regarding forward looking statements: This news release contains forward-looking statements regarding future events and Silver Bull's future results that are subject to the safe harbors created under the U.S. Private Securities Litigation Reform Act of 1995, the Securities Act of 1933, as amended (the "Securities Act"), and the Securities Exchange Act of 1934, as amended (the "Exchange Act"), and applicable Canadian securities laws. Forward-looking statements include, among others, statements regarding estimated payable production, anticipated processing rates and tonnage, expected recovery rates, anticipated life of mine, average cash costs net of by-product credits, expected capital and operating costs, life of mine costs, expected Before Tax NPV, IRR and payback, expected After Tax NPV, IRR and capital payback, the mine production schedule, strip ratios, estimates of resources and potential mining of additional "lower" grade ore. These statements are based on current expectations, estimates, forecasts, and projections about Silver Bull's exploration projects, the industry in which Silver Bull operates and the beliefs and assumptions of Silver Bull's management. Words such as "expects," "anticipates," "targets," "goals," "projects," "intends," "plans," "believes," "seeks," "estimates," "continues," "may," variations of such words, and similar expressions and references to future periods, are intended to identify such forward-looking statements. Forward-looking statements are subject to a number of assumptions, risks and uncertainties, many of which are beyond our control, including such factors as the results of exploration activities and whether the results continue to support continued exploration activities, unexpected variations in ore grade, types and metallurgy, volatility and level of commodity prices, the availability of sufficient future financing, potential changes to royalties and taxes imposed by the Mexico government and other matters discussed under the caption "Risk Factors" in our Annual Report on Form 10-K/A for the fiscal year ended October 31, 2012, as amended, and our other periodic and current reports filed with the SEC and available on www.sec.gov and with the Canadian securities commissions available on www.sedar.com. Readers are cautioned that forward-looking statements are not guarantees of future performance and that actual results or developments may differ materially from those expressed or implied in the forward-looking statements. Any forward-looking statement made by us in this release is based only on information currently available to us and speaks only as of the date on which it is made. We undertake no obligation to publicly update any forward-looking statement, whether written or oral, that may be made from time to time, whether as a result of new information, future developments or otherwise.